By Kendra Park Pasztor, Better Cotton Initiative Senior Manager – Monitoring, Evaluation & Learning
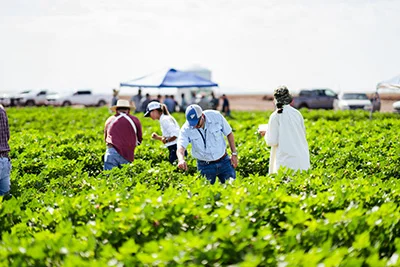
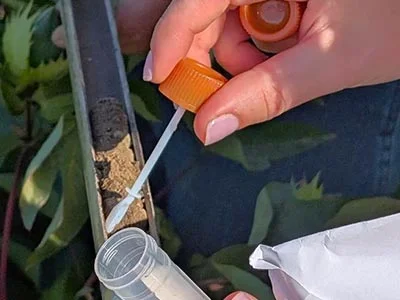
At Better Cotton, we think a lot about cotton sustainability data. Together with our Implementing Partners, we collect and analyse millions of data points each year from countries across the world about fertiliser and pesticide use, irrigation water, yields and smallholder profitability.
Comparing Better Cotton Farmer results

Our analytics team turns that data into interactive results dashboards for country programme and partner staff. We publicly report country-level averages to share insight on licensed Better Cotton Farmer seasonal results compared to farmers in the same regions not yet engaged with Better Cotton. For example, in the 2018-19 season, Better Cotton Farmers in India used 10% less pesticides, and Better Cotton Farmers in Pakistan used 15% less water than Comparison Farmers.
Analysing sustainability hotspots
We are also using the results monitoring data to inform our global analysis of cotton sustainability hotspots. This enables the identification of challenges at the national level where Better Cotton and our partners are working. More granular inquiry into the data combined with national partner expertise is leading to strengthened programmatic approaches for impact. With this in mind, we are growing our team to focus on using data insights to improve programmes.
Improving data collection and digitisation
Over the past couple of years, Better Cotton has been making notable investments in digitisation, including developing a cloud database and current piloting of Agritask’s specialised agritech tool in India. Moving forward, we will look at ways to leverage improved data quality and collection to enable a faster learning feedback loop and add value for farmers via new information and services.
Taking the lead to strengthen measurement and reporting
Since 2019, Better Cotton has been leading a major project – the Delta Framework – that will redefine how we measure sustainability for agriculture, starting with cotton and coffee. By producing a clear, consistent way to monitor and report the progress of participating farms towards sustainable agriculture, the holistic and actionable framework will enable everyone involved to identify opportunities for continuous improvement, take action to support change and ultimately allow the whole sector to communicate its progress. The project is also developing guidance for aggregating farm-level data up to national averages for specific commodity sectors to improve reporting on the Sustainable Development Goals (SDGs).


What about Life Cycle Assessment*?
Better Cotton is not planning to commission or participate in a standalone global life cycle assessment (LCA) of Better Cotton. LCAs are a useful tool to identify hotspots and priority areas for attention for a select set of environmental indicators. The LCAs published over the years have, for example, contributed to the sector’s understanding of what drives climate change from cotton cultivation and what are the best ways to mitigate it.
Standalone LCAs are not, however, an appropriate tool to make general, system-wide, global comparisons between identity cottons and conventional cotton[1]. The fact that Better Cotton’s portfolio in terms of geographies is completely different from that of organic or conventional, and the seasons of analysis vary means the results are not comparable. The UN’s Fashion Industry Charter for Climate Action Raw Materials Working Group’s recent report, “Identifying Low Carbon Sources of Cotton and Polyester Fibers”, highlighted this problem.
What about Life Cycle Inventories*?
One of the Fashion Charter report’s main recommendations to the apparel and textile sector is to move away from standalone LCAs and instead use life cycle inventories (LCIs) and qualitative criteria around production impacts.
Better Cotton agrees with adjusting focus to LCIs that can provide more timely, granular insights to follow trends and galvanise action. We are moving in that direction in line with the Delta Framework with the development of a GHG emissions metric that we will report on at country level. Over the past year, we have tested the Cool Farm Tool’s robust GHG quantification tool.
We also agree with the recommendation to complement LCI data with qualitative criteria or measures. LCIs provide only a subset of what is of concern when it comes to sustainability in cotton production. Socio-economic issues – extremely important to the millions of people involved in growing cotton – are invisible; other environmental issues are partially covered but lack scientific consensus, like biodiversity and pesticide toxicity.
Our Focus Moving Forward
What our sector needs now is to reorient to credibly measuring change over time. With the climate crisis and fast-approaching 2030 deadline for the SDGs, we should all be thinking about how LCIs combined with other methods can help us understand where progress is being made and where gaps remain. Now is the time to seek out the tough challenges and invest in solving them.
For programmes like Better Cotton that are striving with their partners to make real change, we must also emphasise the importance of impact evaluation that includes robust counterfactual methodologies. You can find more information on other research and impact evaluations on ISEAL’s Evidensia. This type of evaluation does something LCIs and LCAs cannot – provide evidence that the outcomes or changes we observe can be attributed to the programme and would not have happened in its absence.
*Life Cycle Assessment (LCA) is a multi-step procedure for calculating the lifetime environmental impact of a product or service. The complete process of LCA includes goal and scope definition, inventory analysis, impact assessment and interpretation. In Better Cotton’s case, a stand-alone LCA would estimate the cotton production phase of cotton garments’ environmental impact.
*Life Cycle Inventory (LCI) is the data collection portion of LCA. LCI is the straight-forward accounting of everything involved in the “system” of interest. It consists of detailed tracking of all the flows in and out of the product system, including raw resources or materials, energy by type, water and emissions to air, water and land by specific substance.
[1] ISO 14040 on LCA, section 5.1.2.4 on comparisons between systems states, “In comparative studies, the equivalence of the systems being compared shall be evaluated before interpreting the results.”

