Better Cotton is the world’s leading sustainability initiative for cotton. Our mission is to help cotton communities survive and thrive, while protecting and restoring the environment.
In just over 10 years we have become the world’s largest cotton sustainability programme. Our mission: to help cotton communities survive and thrive, while protecting and restoring the environment.
Better Cotton is grown in 22 countries around the world and accounts for 22% of global cotton production. In the 2022-23 cotton season, 2.13 million licensed Better Cotton Farmers grew 5.47 million tonnes of Better Cotton.
Today Better Cotton has more than 2,700 members, reflecting the breadth and diversity of the industry. Members of a global community that understands the mutual benefits of sustainable cotton farming. The moment you join, you become part of this too.
The founding premise of Better Cotton is that a healthy sustainable future for cotton and the people that farm it is in the interests of everyone connected with it.
Let us help you find what you’re looking for
Results for {phrase} ({results_count} of {results_count_total})
Displaying {results_count} results of {results_count_total}
Better Cotton works extensively in Pakistan, but traditionally the data we have collected about farmers, producers and partners has not been designed to accurately map their location and activities. This has resulted in supply chain inefficiencies and a lack of new opportunities for those involved in the sector.
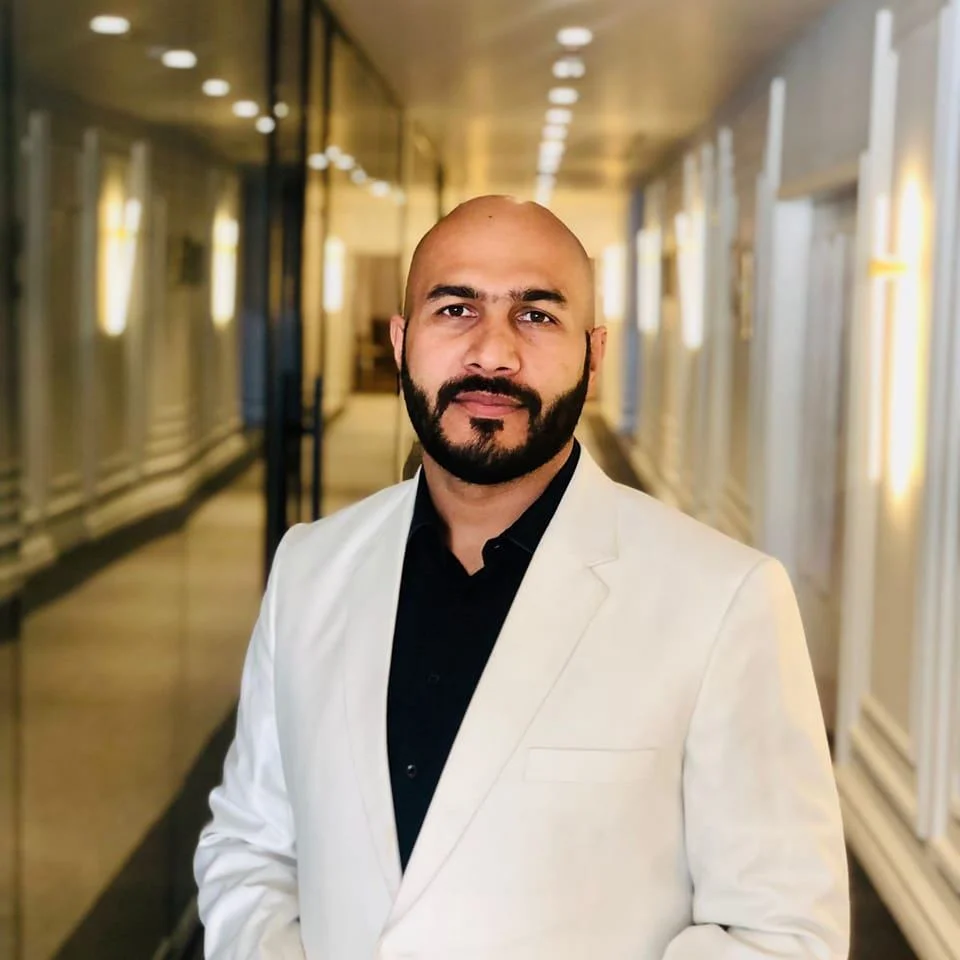
A new pilot scheme aims to improve mapping data and thereby rationalise country programming – we sat down with Muhammad Qadeer ul Hussnain, Digital Agriculture Manager at Better Cotton, to find out all about it.
Photo credit: Better Cotton/Muhammad Ishtiaq. Description: Muhammad Qadeer ul Hussnain.
Can you give us an overview of the pilot?
Pakistan has one of the largest numbers of farmers of all Better Cotton-producing countries, spread over 22 districts in two provinces, organised into more than 125 Producer Units (PUs), and managed by six partners. As Better Cotton’s programme has developed, new and increasingly complex questions have emerged.
Historically, we’ve relied on tabular data for answers, but now we are adding a geographic dimension to it as well. As a result, Better Cotton is running a pilot to map three districts. Reflecting advances in geographical information system technology, remote sensing and ground data, we opted to turn to geographical mapping for the first time.
The concept was formulated in December 2022, work began to map the districts in question in March, and the pilot will end in July. It is providing customised maps of the three districts resulting in a visual representation of the study area, highlighting factors like the location of the growers, ginners and partners.
What were the pilot’s origins?
Our Pakistan country management team wanted to better assess the organisation’s reach, be able to identify shifting trends in cotton cultivation, and significantly improve data quality. Data is the bedrock of programmes based on numbers, and with different reporting methods and a lack of clarity, we wanted to introduce a system with stronger checks and balances.
For example, we know the districts where farmers work with us, but we lack both exact numbers and the location of those growers who aren’t partnered with the initiative. As a result, we weren’t able to work out why a farmer doesn’t fall under the Better Cotton umbrella. Are they too far from the programme partner in the district? Are they part of a neglected minority? It was previously impossible to tell.
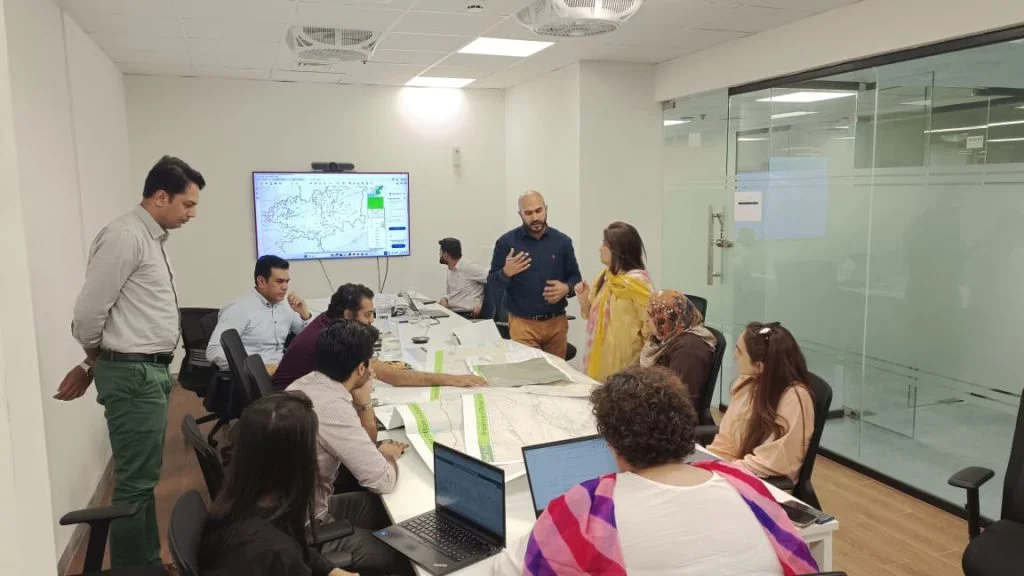
Photo credit: Better Cotton/Muhammad Umar Iqbal. Description: Better Cotton Pakistan team working on geographical mapping pilot.
How did you implement the pilot?
This pilot relies heavily on open-source tools, technologies and data sources. Using publicly available material from the Survey of Pakistan (SoP), Open Street Map (OSM), the Election Commission and local government, we’ve created base maps to locate villages where Learning Groups (LGs) are formed.
For ginners, we’ve taken our existing data, like addresses and locations, and plotted these coordinates on the map. Further analysis has been employed to calculate the distances of LGs from the ginners. Laid onto this is satellite imagery, which provides much higher-resolution data and is good for crop mapping. Using an algorithm that highlights the location of fields and references data over five years, we were able to work out where cotton is being repeatedly grown.
Changing how we measure and evaluate our reach in the three pilot districts has resulted in a different sort of thinking. The data creates lots of new possibilities in terms of what we can measure, questions we can ask (particularly of our partners and their activities), as well as potential supply chain benefits. We also need to think about how to realign assessment processes.
What are your initial findings?
The findings are still being collated, but early indications are that the mapping process will provide valuable suggestions to improve country programming, partner management, evaluation and assessment. This, in turn, will result in efficiency gains, cost efficiencies and better programme management.
Our new maps highlight where cotton cultivation has dropped (and so investment does not represent value for money), and where there is a mismatch in partner operations. It also offers potential improvements to the supply chain, for example highlighting to growers the locations of their closest ginners.
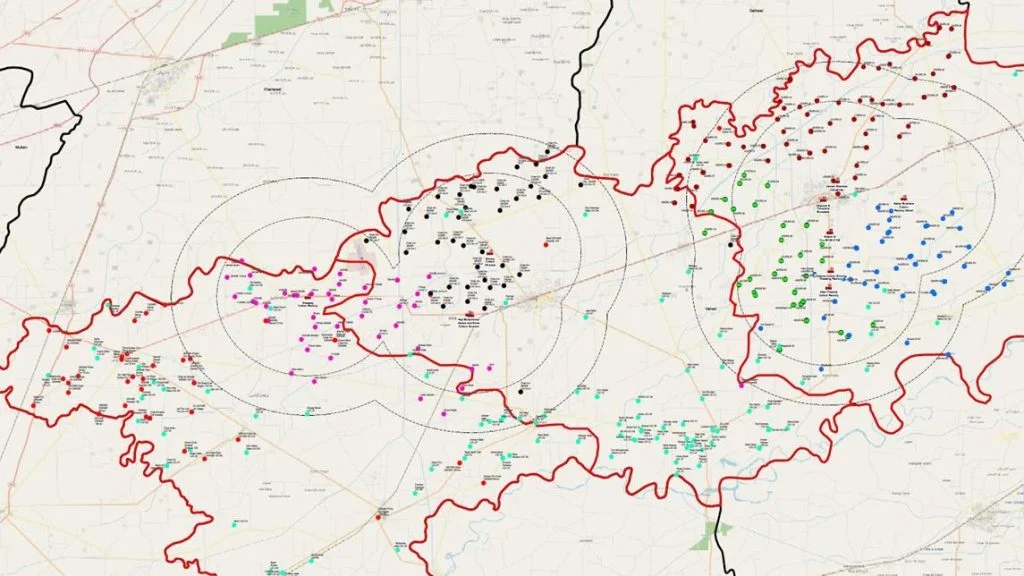
Photo credit: Better Cotton/Muhammad Qadeer ul Hussnain. Description: Sample of geographical mapping.
What are the pilot’s longer-term goals?
This is a tiny pilot project, but one that may be able to be replicated globally. We’ve devised a methodology that works and we’d like to scale this up. What we’ve created is applicable to the rest of Pakistan, while other countries could use a similar approach.
We plan to develop an atlas of Better Cotton, mapping working areas with programme partners, growers and ginners. In turn, this will highlight the actual scale and reach of our operations, while also offering new and improved opportunities to partners and helping improve supply chain coordination.
Newsletter sign-up
Do you want to know what the largest cotton sustainability programme in the world is up to? Keep up to date with the latest developments and hear from BCI Farmers, Partners and Members in the new BCI Quarterly Newsletter. BCI Members also receive a Monthly Member Update.
Leave a few details below and you’ll receive the next newsletter.
We’ve updated our Data Privacy Policy
These updates are intended to reflect changes to the Better Cotton Platform’s default sharing settings and data use in our Audit management system.
You don’t need to do anything to accept these changes – they’re effective from today, 2 April 2025.
You can read the full text by visiting our Data Privacy Policy page.